In 2024, domestic insurers continued refining their investment and risk management strategies in response to evolving financial conditions and regulatory shifts. While the initial impact of IFRS 17, IFRS 9, and K-ICS implementation was absorbed in 2023, insurers focused on optimizing asset allocations under the new capital framework. With persistent interest rate volatility and growing concerns over long-term yield sustainability, we adopted a balanced approach, prioritizing stable returns and capital efficiency.
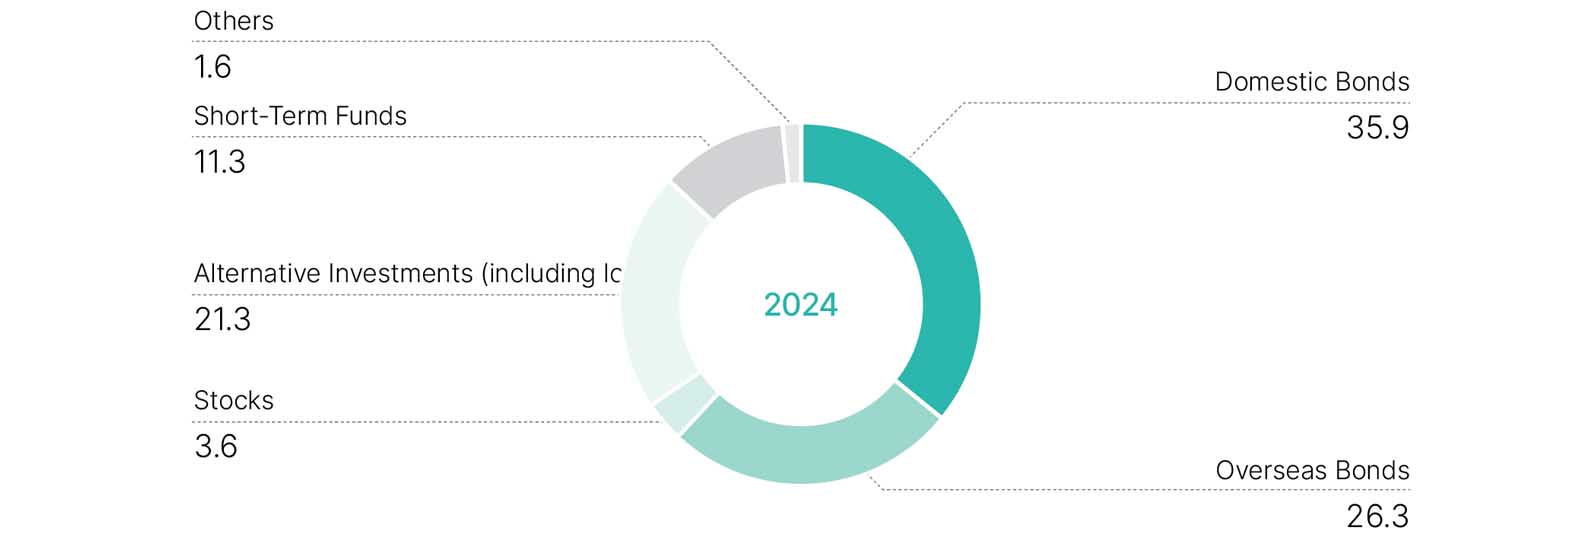
As a result, our total investment income increased by 45.9% to KRW 387.1 billion, while our total investment portfolio grew by 10.3% to KRW 10.68 trillion, reflecting effective portfolio management. At year-end, bond holdings accounted for 62.2% (approximately KRW 6.64 trillion) of total invested assets, while alternative investments, including loans, comprised 21.3% (KRW 2.27 trillion), as we adjusted our portfolio in line with risk downsizing strategies.
The U.S. economy remained resilient despite initial slowdown concerns. The Federal Reserve cautiously began cutting interest rates as inflation eased, while the S&P 500 continued to rise, fueled by AI and tech sector gains. However, bond market volatility persisted as investors reacted to shifting monetary policies. Geopolitical uncertainties, including U.S.-China trade tensions and conflicts in the Middle East, further contributed to market instability.
In Korea, GDP growth rebounded modestly to 2.1%, driven by recovering semiconductor exports and consumer spending. Still, structural challenges such as weak domestic demand persisted. The Bank of Korea maintained its policy rate at 3.5% for most of the year before lowering it to 3.0% in the fourth quarter, aligning with global monetary easing trends. In response, insurers diversified investments and strengthened risk management to adapt to shifting financial conditions.
Two key factors drove the growth of our investment assets and operating income. First, net inflows from insurance operations exceeded expectations by KRW 350 billion, allowing for expanded investment deployment. Second, the appreciation of the U.S. dollar and other foreign currencies resulted in foreign exchange valuation gains exceeding KRW 300 billion, further enhancing our financial position.
Despite KRW 10.1 billion in capital losses from bond sales, we strategically rebalanced our portfolio by replacing lower-yielding bonds with higher-yielding alternatives in a high-rate environment. This reinvestment improved our book yield, ensuring more stable long-term returns. As a result, investment performance in 2024 remained strong, with domestic bond returns surging 46% to KRW 145.8 billion, while overseas bonds generated KRW 93.3 billion in investment income. Elevated interest rates also contributed to robust interest earnings.
Meanwhile, alternative investment income amounted to KRW 124.3 billion, a level similar to that of the previous year. Given economic uncertainties, including the U.S. presidential election, we scaled back alternative investments from our initial plans. However, solid interest and dividend income helped offset the impact, ensuring overall portfolio stability.
The global economy in 2025 is expected to remain sluggish, with inflation stabilizing and interest rate cuts anticipated in the second half of the year. However, uncertainty is still high as the U.S. Federal Reserve takes a cautious approach to rate reductions, balancing inflation concerns driven by Trump’s tariff policies and increased government bond issuance. In Korea, despite economic slowdown concerns, gradual rate cuts are expected, as the high exchange rate and household debt burden limit monetary policy flexibility. Rising global uncertainties and weakening industrial competitiveness reinforce the need for a prudent investment approach to navigate a prolonged low-growth environment.
In response, our 2025 investment strategy will focus on optimizing returns and preserving book yield amid expected rate cuts. We will prioritize corporate bonds and alternative debt instruments over government bonds to enhance profitability. Additionally, we aim to improve the quality of our alternative investment portfolio and gradually increase overseas exposure. We will also continue reducing low-yield assets like demand deposits and establish liquidity limits by overseas branches to enhance short-term fund management, with a view to becoming more effective in how we allocate and manage our capital.
Building on last year’s efforts, we will continue refining our Strategic Asset Allocation (SAA) framework in 2025. Our focus will be on optimizing expected returns relative to risk exposure to determine long-term investment allocations and strengthen asset-specific management guidelines. As part of this initiative, we plan to introduce benchmarks for securities and implement performance evaluations across asset classes, reinforcing a structured and disciplined investment approach.
█ Investment Results 1)
(Units: KRW billion, USD million)
| 2024 (KRW) | 2024 (USD) | 2023 (KRW) | 2023 (USD) | |
| Invested Assets | 10,680.2 | 7,195.0 | 9,679.3 | 7,434.2 |
| Investment Income2) | 387.1 | 282.9 | 265.3 | 201.1 |
| Investment Income3) | 657.6 | 480.6 | 295.2 | 223.7 |
| Yield (%)2) | 3.9 | 3.9 | 3.0 | 3.0 |
| Yield* (%)3) | 6.7 | 6.7 | 3.3 | 3.3 |
1) Investment results are based on IFRS 9
2) Excluding the insurance finance result
3) Including gains/losses from foreign exchange and interest rate hedging for insurance liabilities
█ Investment Results 1)
(Units: KRW billion, USD million)
2024 (KRW) |
2024 (USD) |
2023 (KRW) |
2023 (USD) |
|
Invested Assets |
10,680.2 |
7,195.0 |
9,679.3 |
7,434.2 |
Investment Income2) |
387.1 |
282.9 |
265.3 |
201.1 |
Investment Income3) |
657.6 |
480.6 |
295.2 |
223.7 |
Yield (%)2) |
3.9 |
3.9 |
3.0 |
3.0 |
Yield* (%)3) |
6.7 |
6.7 |
3.3 |
3.3 |
1) Investment results are based on IFRS 9
2) Excluding the insurance finance result
3) Including gains/losses from foreign exchange and interest rate hedging for insurance liabilities
█ Investment Income
(Units: KRW billion, USD million)
| 2024 (KRW) | 2024 (USD) | 2023 (KRW) | 2023 (USD) | |
| Domestic Bonds | 145.8 | 106.5 | 99.7 | 75.6 |
| Overseas Bonds | 93.3 | 68.2 | 23.7 | 18.0 |
| Stocks | 7.7 | 5.6 | 2.0 | 1.5 |
| Alternative Investments 1) | 124.3 | 90.8 | 124.0 | 94.0 |
| Short-Term Funds | 27.9 | 20.4 | 20.2 | 15.3 |
| Others | -11.9 | -8.7 | -4.3 | -3.3 |
| Total (excluding derivatives) |
387.1 | 282.9 | 265.3 | 201.1 |
| Derivatives 2) | 270.5 | 197.7 | 29.9 | 22.7 |
| Total | 657.6 | 480.6 | 295.2 | 223.7 |
1) Alternative investments include loans and structured notes.
2) Gains and/or losses from foreign exchange and interest rate hedging for insurance liabilities
█ Investment Income
(Units: KRW billion, USD million)
2024 (KRW) |
2024 (USD) |
2023 (KRW) |
2023 (USD) |
|
Domestic Bonds |
145.8 |
106.5 |
99.7 |
75.6 |
Overseas Bonds |
93.3 |
68.2 |
23.7 |
18.0 |
Stocks |
7.7 |
5.6 |
2.0 |
1.5 |
Alternative Investments 1) |
124.3 |
90.8 |
124.0 |
94.0 |
Short-Term Funds |
27.9 |
20.4 |
20.2 |
15.3 |
Others |
-11.9 |
-8.7 |
-4.3 |
-3.3 |
Total(excluding derivatives) |
387.1 |
282.9 |
265.3 |
201.1 |
Derivatives 2) |
270.5 |
197.7 |
29.9 |
22.7 |
Total |
657.6 |
480.6 |
295.2 |
223.7 |
1) Alternative investments include loans and structured notes.
2) Gains and/or losses from foreign exchange and interest rate hedging for insurance liabilities
█ Invested Assets
(Units: KRW billion, USD million)
| 2024 (KRW) | 2024 (USD) | 2023 (KRW) | 2023 (USD) | |
| Domestic Bonds | 3,833.8 | 2,582.7 | 3,717.5 | 2,855.2 |
| Overseas Bonds | 2,804.7 | 1,889.5 | 2,048.0 | 1,573.0 |
| Stocks | 389.4 | 262.3 | 315.4 | 242.2 |
| Alternative Investments (including loans) |
2,274.6 | 1,532.3 | 2,278.1 | 1,749.7 |
| Short-Term Funds | 1,203.3 | 810.6 | 1,133.1 | 870.3 |
| Others | 174.4 | 117.5 | 187.2 | 143.8 |
| Total | 10,680.2 | 7,195.0 | 9,679.3 | 7,434.2 |
* Individual figures may not add up to the total shown due to rounding.
█ Invested Assets
(Units: KRW billion, USD million)
2024 (KRW) |
2024 (USD) |
2023 (KRW) |
2023 (USD) |
|
Domestic Bonds |
3,833.8 |
2,582.7 |
3,717.5 |
2,855.2 |
Overseas Bonds |
2,804.7 |
1,889.5 |
2,048.0 |
1,573.0 |
Stocks |
389.4 |
262.3 |
315.4 |
242.2 |
Alternative Investments(including loans) |
2,274.6 |
1,532.3 |
2,278.1 |
1,749.7 |
Short-Term Funds |
1,203.3 |
810.6 |
1,133.1 |
870.3 |
Others |
174.4 |
117.5 |
187.2 |
143.8 |
Total |
10,680.2 |
7,195.0 |
9,679.3 |
7,434.2 |
* Individual figures may not add up to the total shown due to rounding.
█ Investment Portfolio Mix in 2024
(Units: %)